Macro Moves in Focus: What's Shaping Markets Now?
Senior Economist Tracy Shuchart and Senior Market Strategist Jim Cagnina unpack the latest macro events shaking up global markets. Dive into our latest biweekly report to uncover the drivers behind recent market moves and position yourself ahead of what's next.
Metals
The metals market experienced dramatic downward pressure this week, with silver prices plummeting the most amid broader market volatility.
Silver Futures
Silver futures suffered a severe decline during the week, with prices dropping from $35.20 to $29.11, representing a substantial 14.62% loss. This marks one of the most significant weekly declines for silver in recent months.
This drop was primarily driven by concerns over weakening industrial demand amid fears of a global recession, intensified by the recent tariffs implemented by U.S. President Donald Trump. Unlike gold, which benefited from its safe-haven appeal, silver's extensive industrial applications—accounting for over half of global demand—made it more susceptible to economic downturns. The gold-silver ratio surged to 100, its highest since June 2020, highlighting silver's underperformance.
Silver: Technical Overview
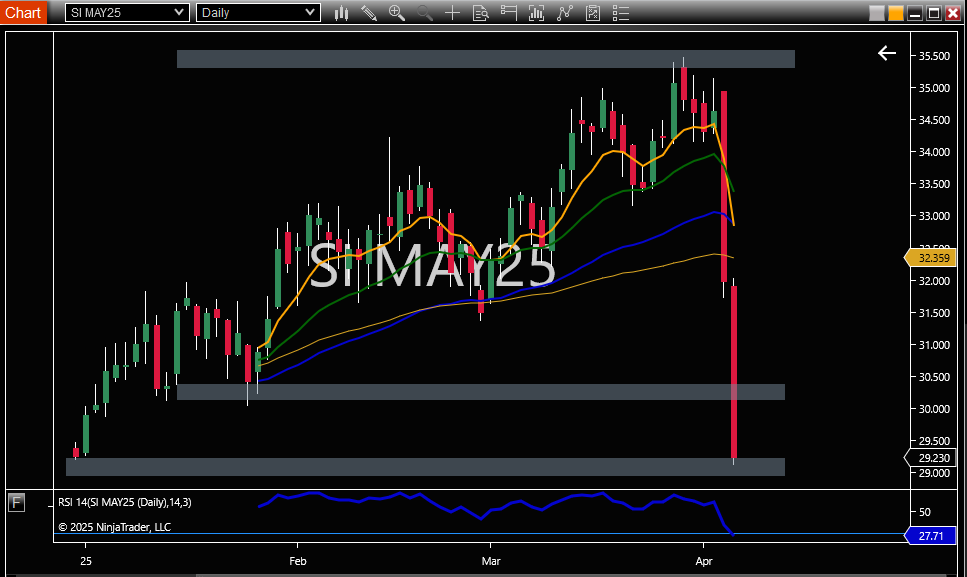
Silver futures briefly tested the $35.50 level early last week before reversing sharply and closing the week with a steep 18% decline at $29.525. Notably, this selloff brought prices right to a key gamma level at $29.50, which acted as a temporary area of support into the close.
Momentum indicators point to continued weakness. The 8-day EMA has aggressively crossed below both the 21-day and 50-day EMAs—an ominous technical signal that reinforces the bearish outlook. Meanwhile, the daily RSI is now in oversold territory at 27.67, which may open the door for a short-term bounce, though no reversal signals are yet in place.
Energy
The energy sector, particularly crude oil, experienced significant bearish pressure throughout the week.
Crude Oil Futures
Crude oil futures declined sharply, falling from $72.28 to $61.99, representing a 14% drop over the five-day period. The price action showed relative stability during the first two trading days before experiencing accelerated selling on Wednesday, Thursday, and Friday.
The most dramatic drops occurred on Thursday and Friday, with oil losing approximately $9.49 in value over the week. Thursday saw prices fall from $70.71 to $66.08, followed by another steep decline on Friday to $60.45 before settling higher.
The significant drop in oil prices can be attributed to several factors:
- Potential increase in global supply from OPEC+ production increase announcement, equating to 411K bpd in May.
- Concerns about global economic growth affecting demand forecasts due to the tariff announcement on April 2.
- Inventory data showing unexpected builds in crude oil stocks
WTI Crude Oil: Technical Overview
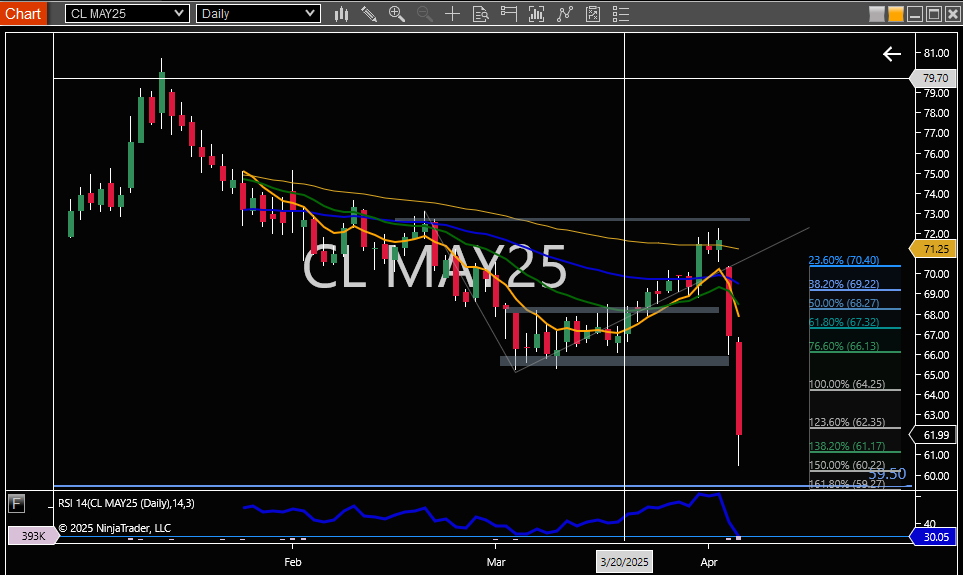
Crude oil abruptly reversed its 11-day rally after peaking at $72.28, breaking sharply below key support at $66.00. By Friday’s Globex close, crude oil had shed 10 handles, settling at $62.32.
If the selling pressure persists, Fibonacci extension levels highlight potential downside targets at $61.17, $60.22, and $59.27. The daily RSI has dipped into oversold territory, currently reading 29.94—suggesting a potential for near-term exhaustion. A small sign of reversal or at least a stall is suggested by the modest buyer's wick on Friday's candle.
Equities
U.S. equities experienced a significant decline during the week, with the S&P 500 falling sharply after initial stability.
S&P 500 Index
The S&P 500 fell from $5,611.85 to $5,074.08, representing a 9.58% decline over the week. The index showed relative stability during the first three trading days, even posting modest gains, before experiencing a sharp sell-off on Thursday and Friday.
Thursday saw the index drop 4.84%, followed by an even steeper decline of 5.97% on Friday. Trading volume increased significantly during the sell-off, with Thursday's volume at 7.21 billion shares and Friday's volume surging to 8.85 billion shares.
The sharp decline in the S&P 500 could be attributed to several factors:
- Heightened volatility in response to tariff “Liberation Day” announcement
- Potential concerns about economic growth and corporate earnings
- Sector rotation as investors reassess risk exposure
- Technical selling pressure after breaking below key support levels
The elevated volume during declining price action suggests strong conviction behind the selling pressure and potential capitulation.
S&P 500: Technical Overview
E-mini S&P 500 futures saw a sharp sell-off last week, decisively breaking Globex key support at 5525 and continuing lower without pause. Friday’s Globex close came in at 5076.75, marking a new low below the August 5th, 2024, level. Notably, there was no end-of-day relief rally or signs of short covering, underscoring the strength of the bearish momentum.
As of now, the E-mini S&P is down 17.20% from its February highs. The 200-day simple moving average, previously a key technical level, has been left behind at 5800.
Looking ahead, a Fibonacci extension (123.60%) projects potential downside to 5022.00. If selling pressure continues, the next key area of support is seen near 4965.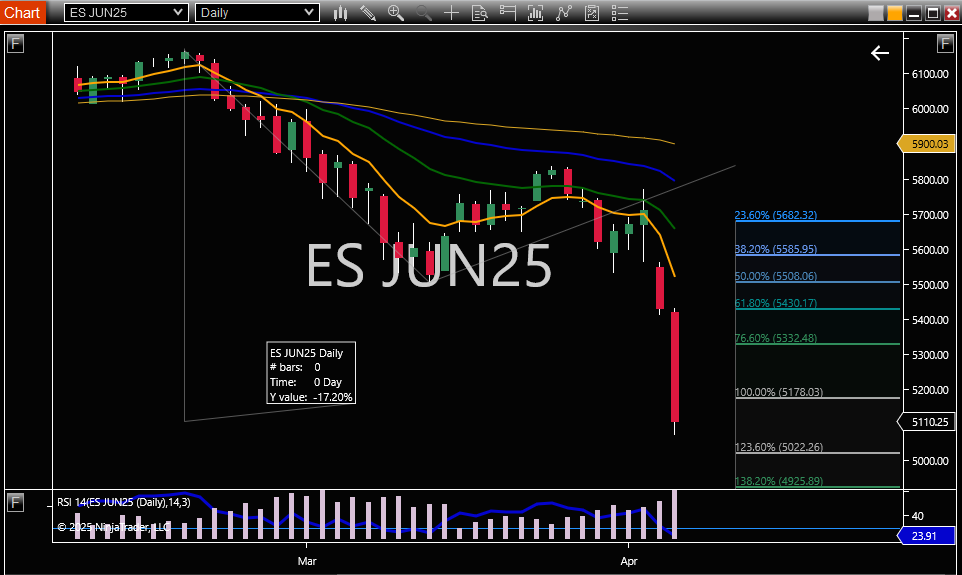
Fixed Income
The bond market reflected the risk-off sentiment seen in other asset classes, with Treasury yields declining significantly.
10-Year Treasury Yield
The 10-year U.S. Treasury yield fell from 4.246% to 3.985%, representing a 6.15% decrease over the week. This decline in yields corresponds to an increase in Treasury prices, indicating a flight to safety as investors moved away from riskier assets.
The most significant drop in yields occurred on Thursday and Friday, with yields falling 0.141% and 0.070% respectively. The break below the 4.0% psychological level suggests a potential shift in market sentiment regarding inflation expectations and future Federal Reserve policy.
The significant decline in Treasury yields coincided with sharp drops in equity markets and commodities, suggesting:
- Increased demand for safe-haven assets amid market volatility
- Potential shift in monetary policy expectations
- Concerns about economic growth prospects
- Possible repositioning by institutional investors in response to changing macroeconomic conditions
Bond market participants should monitor upcoming economic data releases for further clues about the trajectory of interest rates.
10-Year Treasury Notes: Technical Overview
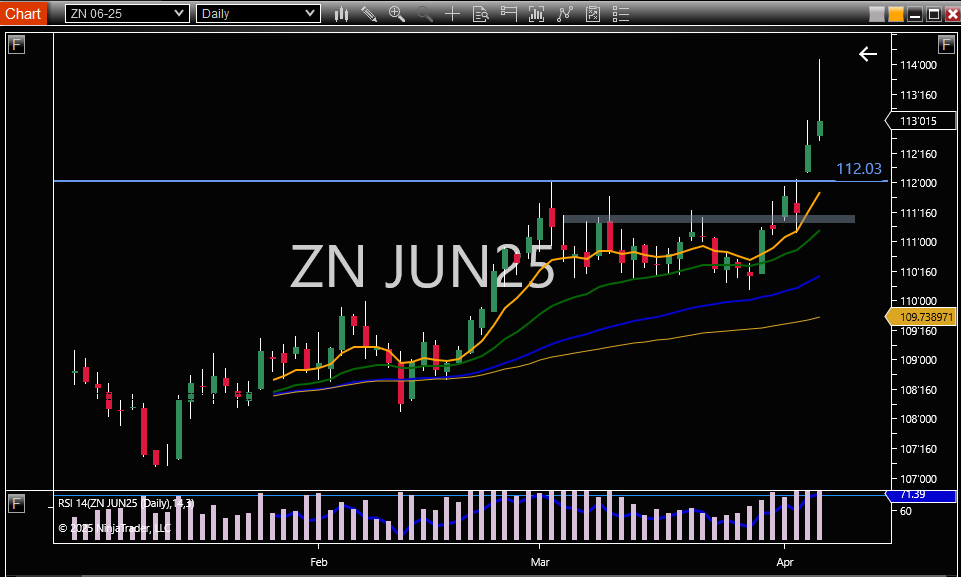
Buyers surged into 10-year U.S. Treasury note futures last week, breaking decisively above the month-long resistance at 111'110. The front-month contract saw heavy volume, with nearly 6 million contracts traded on Friday alone.
The five-day rally pushed prices two full points higher, driving the 10-year yield down to the key psychological level of 4.00%. Momentum remains strong, though daily RSI is now slightly overbought at 71.30—suggesting the potential for a pause or short-term consolidation. A noticeably large sellers wick on Friday's daily candle may confirm a slowdown on the run up.

Trade Futures with NinjaTrader
Haven't signed up for your free NinjaTrader account yet? Get started today with a 14-day trial of live simulated futures trading.
