Joseph Granville developed and introduced the on-balance volume (OBV) indicator to the technical analysis community in his 1963 book “Granville’s New Key to Stock Market Profits.” It has since become a popular indicator used to measure buying and selling pressure.
OBV is a running total of volume. When the instrument closes higher than the previous close, all the day’s volume is considered up-volume. Conversely, when the instrument closes lower than the previous close, all the day’s volume is considered down-volume.
Granville’s theory behind OBV is that volume precedes price. When volume increases without any major moves in the price of an instrument, the instrument eventually “springs” up. Similarly, when an instrument’s price remains unchanged, yet volume is noticeably decreasing, this instrument is poised to fall.
The value of the OBV indicator itself does not hold much merit. Rather, it is the behavior of the OBV line that technical analysts use to forecast potential market moves via a variety of methods.
Trend Identification and Confirmation
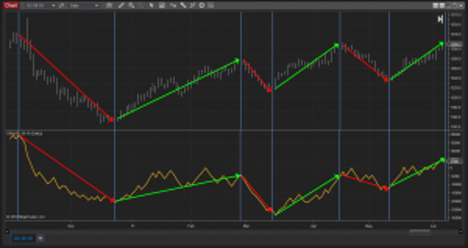
Determining the trend of the OBV and comparing it to the trend of the instrument being studied can serve as a valuable trend confirmation tool. When OBV trends higher alongside price, it suggests strong buying pressure and confirms an uptrend. If OBV trends downward in tandem with price, it confirms a downtrend. However, if price is making new highs while OBV remains flat or declining, this may indicate weakening momentum and a potential reversal.
Support and Resistance Levels
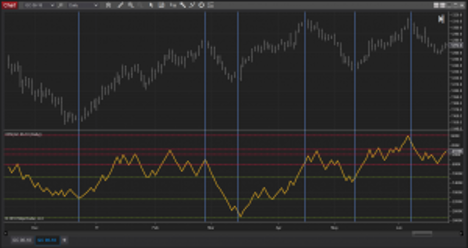
Just like price charts, OBV can exhibit support and resistance levels. Traders can manually draw support and resistance zones on the OBV indicator to provide additional insights into potential market behavior. If OBV repeatedly meets a resistance level and fails to break higher while price remains stable, this could signal a potential reversal or slowdown in bullish momentum. Likewise, if OBV finds support and bounces while price holds steady, it could indicate a future upward move.
Identifying Divergence
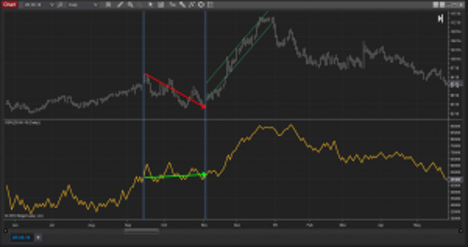
Spotting divergence between an instrument’s price and the OBV indicator can be challenging but offers powerful insights. Divergence occurs when price moves in one direction while OBV moves in the opposite direction, signaling a trading chart pattern called a potential trend reversal.
For instance, bullish divergence occurs when price is making lower lows, but OBV is making higher lows. This indicates that selling pressure is weakening despite declining prices, and a bullish reversal could be imminent. Conversely, bearish divergence is observed when price is making higher highs, but OBV is making lower highs, suggesting that buying pressure is waning and a downward move may follow.
Limitations of OBV
While the OBV indicator is a valuable tool, it is not foolproof. Because OBV is often used to predict market reversals, false signals can be common. Sudden spikes in volume caused by external factors, such as news events, can lead to misleading OBV signals. Therefore, traders should use OBV in conjunction with other technical and fundamental analysis tools for more accurate decision-making.
Using OBV in NinjaTrader
The OBV is just one of over 100 free indicators available on the award-winning NinjaTrader platform. NinjaTrader provides futures traders with advanced charting tools, customizable indicators, and a powerful trading interface to effectively analyze market trends and enhance their trading strategies. Whether used for confirmation or divergence spotting, see how the OBV can be a valuable addition to your technical analysis toolkit.

Trade Futures with NinjaTrader
Haven't signed up for your free NinjaTrader account yet? Get started today with a 14-day trial of live simulated futures trading.
