Wouldn’t it be great if we had a barometer to measure the tension building or relaxing under the surface of the futures markets? In essence, that’s what the Volatility Index (VIX) provides for traders. The VIX tracks market expectations for volatility in real time, signaling increased risk for possible downside moves or decreasing risk that may allow markets to rise.
Calculating the VIX
The VIX is calculated using the prices of near-term S&P 500 Index options on the Chicago Board of Options Exchange (CBOE). It reflects the market’s expectations for a potential 30-day percent move, up and down, in the S&P 500 cash index.
The calculation involves a complex formula that estimates expected volatility by averaging the weighted prices of a wide range of put and call options, allowing for a snapshot of market sentiment and risk perception. This process captures both the intensity and direction of volatility, making the VIX a valuable sentiment indicator for traders looking to gauge potential swings in the market.
One crucial aspect of the VIX is its inverse correlation with the S&P 500 Index; when volatility rises, S&P 500 prices typically fall, and vice versa. Spikes in the VIX are often associated with significant market lows in the S&P 500, signaling potential opportunities for swing traders. (Figure 1)
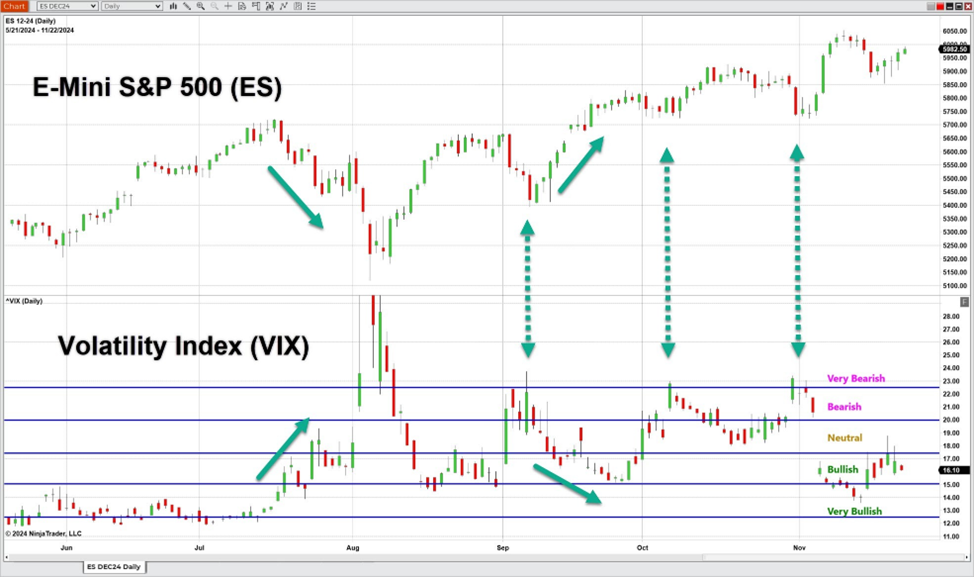 Figure 1: A chart of the inverse relationship of the S&P 500 Index and the VIX
Setting Levels for Market Sentiment
By analyzing historical Volatility Index data, we can establish benchmark levels to interpret current market sentiment:
- <15: very bullish
- 15 - 17.50: bullish
- 17.50 - 20: neutral
- 20 - 22.50: bearish
- 22.50: very bearish
However, these levels can shift as market conditions and perceived risks evolve.
Market Makers Driving the VIX
The VIX, often called the “fear gauge,” can provide unique insights into the directional sentiment of S&P 500 options market makers. Since options markets are market-maker driven, options pricing and in turn the VIX reflect the underlying risk that professional traders perceive and are willing to take. As market makers manage their risk by adjusting option prices, traders can use the VIX to see how sentiment is changing in real time.
A Valuable Way to Gauge Risk
The Volatility Index is much more than just another data point or indicator—it’s the market’s barometer for current market sentiment. A valuable way to gauge risk, it can help traders anticipate changes in price activity, react better to potential downside risk, and spot turning points in the market.
In addition to the S&P 500 Index, similar indices are available from the CBOE for the Nasdaq 100 and commodities like gold and crude oil, allowing traders to apply the same approach across various markets.
Unlock Free Exclusive Training
Explore the foundational concepts of technical analysis with our free multi-video trading course “Technical Analysis Made Easy.” Learn how to analyze and anticipate market movements using market prices, volume data, and more.
We’re Live Every Trading Day
Prep for the trading day ahead, analyze the markets in real time, and explore our award-winning platform during our daily livestream. Watch live here or catch what you missed on our YouTube channel.
Trade Futures with NinjaTrader
Haven't signed up for your free NinjaTrader account yet? Get started today with a 14-day trial of live simulated futures trading.
