In the world of commodities trading, the gold futures market is uniquely positioned for traders of all sizes to speculate on the price of this vital precious metal. It’s a complex market driven by geopolitical events, supply and demand dynamics, and global economic conditions. As complex as it is, it’s virtually impossible for any trader to know about everything that drives the price of gold.
This is where gold futures technical analysis comes in. While no single trader has all the fundamental information on gold futures, they can be confident that the traded price reflects the collective knowledge of all participants. We can see that price in real time and historical charts, which we can analyze technically to help us make smarter trading decisions.
Technical indicators for day trading gold futures
Most self-directed retail futures traders speculating on short-term and mid-term price swings in the price of gold utilize technical analysis tools and indicators to help determine entry and exit points. Technical indicators are used on historical price charts to help identify price trends, chart patterns, and key trading levels. There are several suitable indicators popular with intraday traders, including:
- Pivots: Used for support and resistance levels
- Previous open/high/low/close (OHLC): Used for support and resistance levels
- Order flow volume-weighted average price (VWAP): Used for trend direction and overbought/oversold conditions
- Order flow volume profile: Used for support and resistance levels
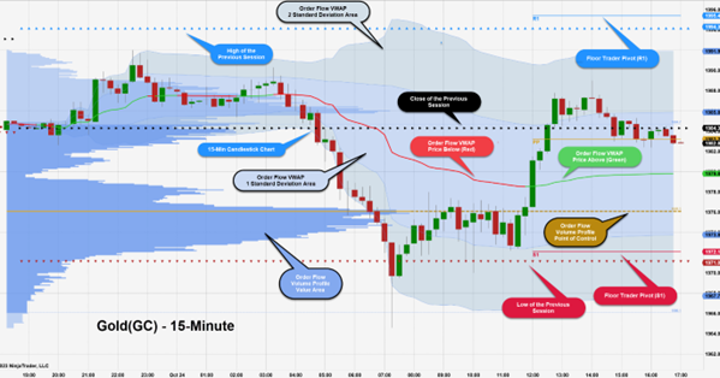 Figure 1: Example of an intraday 15-minute gold chart with these indicators applied: pivots, previous OHLC, order flow VWAP, and order flow volume profile.
Each of the indicators on the gold chart in Figure 1 is designed to provide traders with insights into the real-time price action of gold to help them make more informed decisions. Intraday traders are typically looking at indicators on shorter time frame interval charts; one, three, five, 10, and 15-minute bars are common and used to identify short-term price action between key areas of support and resistance.
For example, the order flow VWAP, which changes from red to green depending on the proximity of the price bars, helps provide an indication of trend direction. The shaded areas away from the VWAP (medium blue and light blue) represent the one and two standard deviation areas, which can also act as dynamic support and resistance levels throughout the session. Learn more about the five key indicators for day trading futures.
Using multi-time frame perspective in gold futures technical analysis
Intraday traders often want a longer multi-time frame perspective to help better gauge directional biases, support and resistance levels, and potential trend reversals. Traders looking for a long-term viewpoint will often apply trend and momentum-type indicators on mid-term time frame interval charts: 30-minute, 60-minute, daily, and even weekly charts are commonly used. There are many suitable indicators popular with intraday traders, such as:
- Commodity channel index (CCI): Used to determine price momentum
- Relative strength index (RSI): Used to identify areas of overbought and oversold trading activity
- Moving averages: Used to determine trend direction. For example, many traders follow 50- and 200-day moving averages; when prices cross these averages, or the averages cross each other, it can indicate a change in trend direction.
- Ichimoku Cloud: A popular multifaceted indicator that can also help confirm trend direction along with key support and resistance trading levels
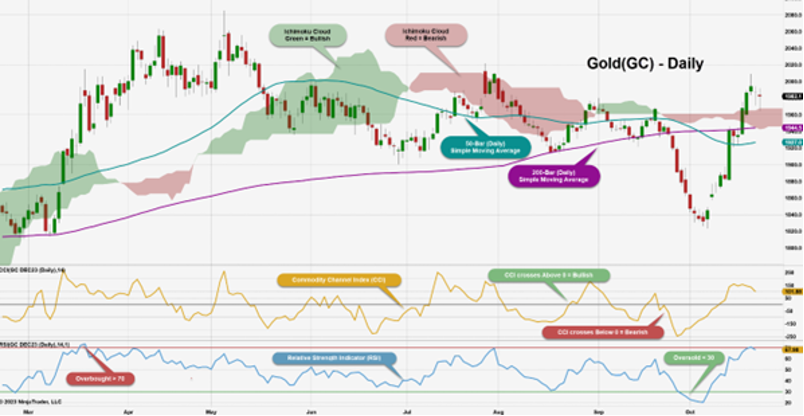 Figure 2: Example of a daily gold chart with these indicators applied: Ichimoku Cloud, 50- and 200-day simple moving averages, CCI, and RSI.
Each of the indicators on the gold chart in Figure 2 is designed to provide a broader view of the market to identify longer-term trends, support and resistance levels, and unique chart patterns.
Level up your technical analysis with NinjaTrader
Here we’ve discussed a few of the different technical indicators used by traders in gold futures technical analysis. However, this is only the tip of the iceberg. Every trader must find their own unique approach to making decisions by combining technical tools, news and reports, and fundamental analysis. When armed with a combination of analytical factors that work for you, you’ll be well on your way to making better and more consistent trading decisions.
Unlock free exclusive training and education
Explore the foundational concepts of fundamental and technical analysis with our free multi-video trading course “Technical Analysis Made Easy.” Learn how to analyze and anticipate market movements using market prices, volume data, and more.
To access these and other exclusive on-demand courses and educational content, sign up for your free NinjaTrader account today.

Find your daily futures trading edge with NinjaTrader Live
Join us six days a week for NinjaTrader Live to get expert analysis, actionable insights, and diverse perspectives—everything you need to trade smarter, all in one place.
